St. Patrick’s Day is an annual feast day celebrating the patron saint, St. Patrick. It’s a national holiday in both Ireland and Northern Ireland. The holiday, taking place on March 17th, has a number of traditions associated with it here in the USA as well—wearing green, eating the traditional Irish corned beef and cabbage, the Chicago River is dyed green, various cities have celebrations (NYC’s parade features over 250,000 marchers)—and then there is beer.
Beer has long been a popular indulgence in St. Patrick’s Day celebrations. Some believe this is due to the Catholic Lenten restrictions on eating and drinking being lifted for the holiday. Regardless, it is true that consumption is high on St. Patrick’s Day – according to WalletHub, 174% more beer is sold on this day than usual!
If your St. Patty’s celebration will include beer, consider this—why does your beer have a certain aroma? Most beers tend to have a unique, yet distinct, scent surrounding them; some smell bitter, some sweet, others rich or heavy. There is undoubtedly a connection between your beer’s aroma and its taste and flavor, so investigating what is actually in your beer, or what the cause of these aromas is, is a relevant analysis. GC-Time-of-Flight Mass Spectrometry has been used in a number of beer-based applications to analyze the aroma profiles of beer, uncovering off-flavors and adulterants which can help with quality control and lead to a more pleasant experience.
Beer Aroma: Detection of Analyte Differences with GC-TOFMS and the Reference Feature in ChromaTOF®
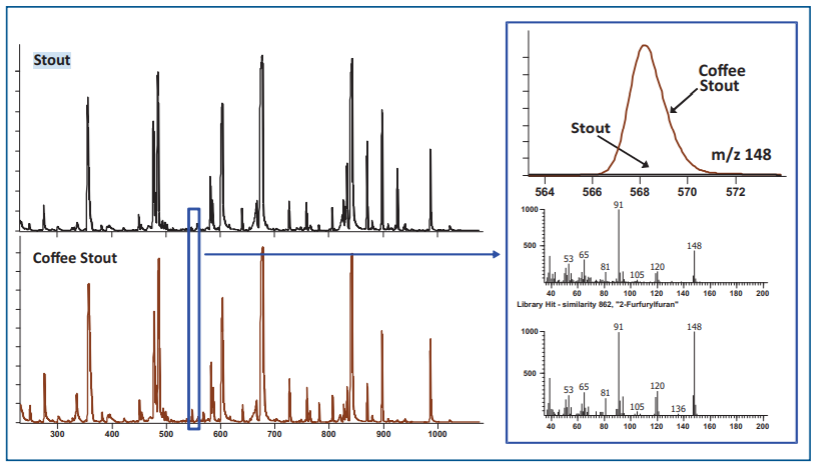
In this application note, GC-TOFMS with ChromaTOF software was used to determine the differences between commercially available craft beers, specifically a stout and a coffee-flavored stout. Non-targeted volatile analysis characterized these beer samples, but it was hard to see the distinctions through a mere visual comparison of representative TIC chromatograms due to the many similarities of the two samples. This is where ChromaTOF software can be utilized. Using Automated Peak Finding and True Signal Deconvolution®, the two coeluting analytes could be compared independently with the «Reference» feature.

Correlation of Chemical and Sensory Data to Track Aging of an American IPA Beer at Different Storage Temperatures
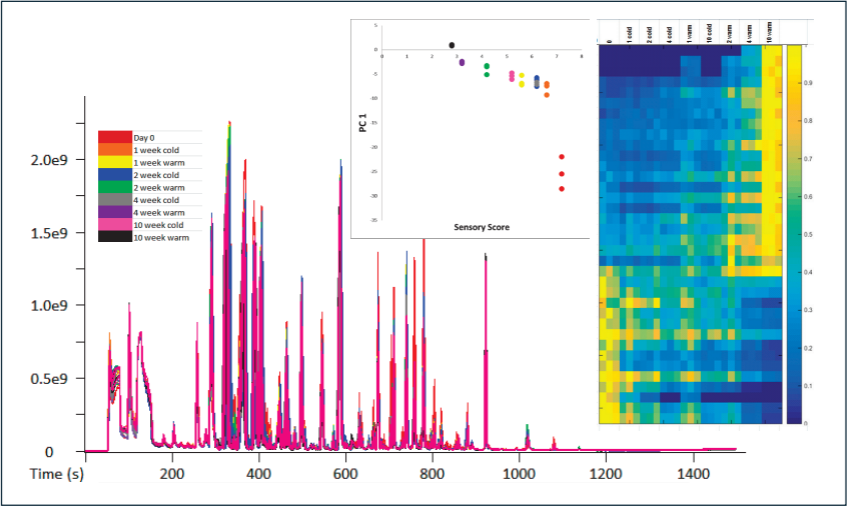
Shelf stability and how products change with age and storage condition is an important topic to both manufacturers and consumers. Understanding changes in the aroma profile over time can help to understand the shelf life of that product and possibly how it can be extended. In this work, we combine chemical analysis with sensory analysis to investigate the shelf stability of an American IPA bottled beer as it relates to storage temperature. A time course series of bottled beer samples were collected so that on the day of analysis a fresh beer and beer at ages 1, 2, 4, and 10 weeks of age were available. Chemical and sensory data were combined, and we observed that freshness generally declines with age and that this degradation occurs at a faster rate with higher temperature storage compared to lower temperature storage. Using both data sets together, we were able better understand these samples than we would have with either data set independently.

Fill out the form below to learn more about how the sensory and chemical analyses were conducted using GC-TOFMS methodology with LECO’s Pegasus® BT.


 To make this site work properly, sometimes we place small data files called cookies on your device. This is a common practice for websites.